Question 1:
Let's say we live in a world where every scientific article is free of selective reporting of methods and analyses that "worked" (no p-hacking in this world). You open a journal, and see lots and lots of statistically significant results (publication bias still exists, I'm guessing). What % of the significant findings that you see will be false positives?

This is the wrong answer to my question. No high five for you.
I recently asked a bunch of people at our weekly social psychology brownbag meeting that very question, and the overwhelming answer was "5%." And that intuitively seems right. We know that (in the absence of p-hacking and other chicanery) we try to set our Type I error rate to 5%. That is, when the hypothesis is wrong, we want to limit things so that our results are significant only 5% of the time.
The catch is, having a 5% Type I error rate does not imply that 5% of significant results are false positives. So, what % of the significant findings that you see will be false positives? It depends. On lots of things, but mostly on statistical power. So, too, does the probability that a given finding will successfully replicate.
So, how can we figure out the false positive rate???
We can treat this question a couple of different ways. First, let's figure out how many statistically significant results a given researcher will find. And here's that:
{[(p) (1-β)] + [(1-p) α]} k
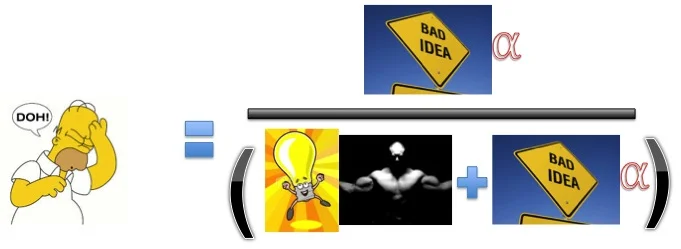
This researcher's hypothesis is likely to be right at probability p. When that's the case, the likelihood of a significant result depends on power (1-β). Sometimes, your hypothesis isn't correct (more specifically, the null is actually true, probability 1-p). In this case, you'll still get significant results at probability α, which we're supposed to set at .05. Then you multiply all of that by k, the number of studies you can run. Since that is all a mouthful, here are some pictures to illustrate the same thing:

Sometimes you're right, and power matters. Sometimes you're wrong and get false positives anyways. Total number of significant results depends also on how many studies you run.
There, that's better. You can look at this and see a few things. For example, if you run smaller studies, but have the same overall number of participants, power (the muscly dude) gets smaller and the number of studies (the scientist looking in the microscope) goes up. This can lead to more significant findings, even though any single study might be grossly underpowered.
So, back to the initial question, What's the likelihood of a false positive?
Using our same picture/notation from above, it'll look like this:
False positive rate. It's the ratio of false positives over the total likelihood of a significant result.
As sample sizes get smaller (or as power gets lower in general), the denominator gets smaller and the numerator stays the same. As a result, DOH! Homer gets bigger. More false positives.
Similarly, the true positive rate will just be 1 minus the false positive rate. Or we could draw it like this:

True positive rate. It's true positives over all significant results.
What else can we do with these calculations?
Back in the day, journals like Psychological Science required people to report a stat called p-rep. It was supposed to document the probability that a given finding would replicate. Unfortunately, it was basically just a transformation of a p-value, and p-values can't tell you the likelihood of a finding replicating. You can't take a p-value, add no information to it, and have a new value do something that p couldn't do. Oh well.
However, if we know the false positive rate and true positive rate, we can calculate replication rates:

Replication rate. When you had a true positive, your replication depends on the power of the replication attempt. You can also "replicate" a false positive, at our same .05 rate.
There you have it. Unlike the p-rep stat, this calculation can tell you the likelihood of a finding replicating. If you know 1) sample size, 2) effect size, and 3) prior probability that the null hypothesis is false, you can calculate all sorts of neat things like power, false positive rates among significant results, and replication rates at various sample sizes!
And, to make things even easier, I developed a web app that will actually do these calculations for you!
Here's the link, go try it for yourself!!!
Use the sliders to enter sample size, effect size and probability that the null is false, and voila! It'll spit out power, false positive rate (among significant results), as well as expected replication rates at both the same sample size and with samples that are 2.5 times as large (which some folks are recommending these days).
Since the prior probability that the null is false can be pretty damn tough to estimate, it'll also spit out a graph showing some consequences (false positive and replication rate) across the whole range of this value.
Enjoy! And drop me a note in the comments if you see anything in need of a tweak.