Warnings and preamble...
Nerd Alert: This post will largely only be of interest to people who are interested in new meta-analytic techniques in the literature under conditions of homogenous and heterogenous underlying effects. And in the presence of publication bias, or not. If that’s your thing, continue. If not, this will bore the hell out of you (it might anyway). But there will be pretty graphs with colors chosen by my 3 year-old daughter. And a music video from the 1980s. To minimize boredom while reading, I suggest you start the music video (posted at the bottom) and listen while reading. It's a catchy tune.

I haven't seen this movie in the while, so hopefully me going for an appreciative hat tip didn't come from a scene where this means something totally different...
Nerd Alert acknowledgements: the grist for this post came from a delightful twitter exchange I had last week with (for the most part) Mickey Inzlicht (@minzlicht), Mike McCullough (@McCullough_Mike), and Evan Carter (@ec_cart). Good stuff from all involved. Felix Schönbrodt really helped me clean up my R code. Evan had some great suggestions for making some of the simulations more realistic. Most of all, Mike McCullough was incredibly helpful and gracious throughout. A tip o' the hat to everyone involved; the next round's on me!
Failed nerd alert: I’m relatively new and self-taught to R in general and simulations in particular. So I might’ve messed up somewhere. I’ll post all my code later on, so feel free to peruse it and suggest tweaks. If something in the code looks good, credit to Felix. If it looks bad, blame to me.
On to the actual show...
Throat clearing aside, how do we collectively estimate how big a given effect is? Or whether an effect even exists? One study can give us an estimate of the underlying effect, but we know that any given study provides a very imperfect estimate of the “true” effect size, inasmuch as the “true” effect size actually exists. So rather than rely on one study’s estimate, we can smoosh a bunch of studies on the same topic together to estimate the common effect size. Another term for “smooshing” is meta-analysis. And there are bunches of different ways to do this.
Now, a given meta-analysis’s accuracy will only be as good as the studies included for smooshing. If one collects all studies ever conducted on a topic and smooshes them together, you should get an accurate and unbiased estimate of the underlying effect. No problems here.
But, in practice, it’s pretty much impossible to gather and smoosh all studies ever conducted on a topic. Some studies are easier to find. Like published studies. And which studies get published? Those studies that happened to show effect sizes large enough to yield statistically significant results given the sample sizes we tend to use. So if you do a meta-analysis looking only at published studies, you’ll in all probability overestimate the underlying effect sizes. This is bad. The published literature overestimates how big effects are.
So, people have tried to come up with lots of tools for meta-analysis that correct for publication bias. There’s trim-and-fill, p-curve, failsafe-n, and a variety of regression-based tools to name a few. Which brings us to today’s topic: PET-PEESE.
What's a PET-PEESE?

In a nutshell, PET-PEESE is a conditional regression-based meta-analytic tool that is claimed to 1) assess the presence or absence of publication bias, and 2) provide an effect size estimate correcting for publication bias. Conceptually, it sounds pretty neat. You gather a bunch of studies, calculate your effect sizes and the standard errors of the effect sizes. Then you predict the effect size from the standard error with a weighted least squares approach (weighted by the inverse of se-squared). Visually, it looks like this:
If the best fit line is sloping, this indicates a relationship between the standard error and the effect size. PET-PEESE advocates argue that this slope indicates publication bias or other forms of small-study effects. And here’s the cool part: if you look at the intercept of the regression, this is supposed to tell you what the effect size would be if the standard error of the effect size is zero. In other words: the effect size of a hypothetical perfect study. That’s PET. PEESE uses the standard error squared instead as the predictor. PET-PEESE says that when PET suggests the existence of a real effect, default to PEESE. Otherwise stick to PET.
All of this sounds great. It's computationally simple, and looks elegant. It makes intuitive sense. It's always fun to interpret the intercept of a regression model. And it has started popping up in psychology publications, mostly in the context of meta-analyses of the self control literature (does the song make sense now? If not, scroll down and play it).
But I started to worry a little bit when I realized that PET-PEESE seemingly assumes a homogenous underlying effect size. This is built into the logic and formula of the test itself. This is kind of equivalent to fixed-effect meta-analysis. Assume there is one underlying true effect, and variation on that is the result of 1) noise, or 2) bias (publication or otherwise). So you suck up the bias somehow, and you should get an estimate of “true effect” +/- “noise.”
Given a homogenous effect size, then a relationship between ES and the standard error seems likely to be a result of publication bias (or other small sample effects…if you see “publication bias” in this post, just mentally fill in the rest). But a relationship between ES and standard errors can also result when the true underlying effect size varies and researchers select appropriate sample sizes. Good power analysis will create a nice relationship between effect size and sample size (and therefore standard error of effect size). This would mean that good researchers who use appropriate sample sizes for varying underlying effects would be PET-PEESE flagged for publication bias, and PET-PEESE would assume that their underlying effect sizes were smaller (or even nonexistent!). Or so my intuition went.
So I ran a quick little simulation where I created a bunch of “studies” that had an effect size of either .4 or .8 (Cohen’s d) and scaled the sample size for adequate power. Every single study comes from a genuine effect (d = .4 or d = .8, chosen at random). But PET-PEESE estimates the underlying effect size as no different from zero. Uh oh. Why does this method take 100 studies showing real effects, and say that on average there is no effect present?

100 studies. Smallest actual effect size is .4. PET-PEESE estimates underlying effect size at about 0. Hmmmm...
As some folks pointed out , this is perhaps illuminating, but not realistic. The eyeball test tells us that the two clusters of studies (d= .2 and .4) should not be included in the same meta-analysis. We are smooshing apples and oranges, rather than apples and apples. This is a fair point. So I decided to dig deeper.
Testing PET-PEESE...
Next, I decided to run 4 sets of big simulations modeling all combinations of 1) heterogenous effects, 2) homogenous effect sizes, A) no publication bias (all studies “published” and included in meta), and B) crazy publication bias (studies are only “published” and included in meta if they yield statistically significant effects). In addition to testing PET-PEESE, I've also been meaning to learn how to do simulations in R for a while, so this was a perfect little project.
In an effort to keep things realistic I had the simulation randomly pick an effect size according to estimates of the effects social psychologists study. For heterogenous effect sizes it picked an effect size at random from the distribution on the left, below (the text is tiny, but the distribution runs from .2 to .4). For homogenous effect sizes, it randomly picked a value right around the mean of the heterogenous distribution (between .27 and .28). For sample sizes, I again tried to keep things realistic (between 20 and 200 per condition, according to the graph on the right). Each study randomly picks an effect size and a sample size from these distributions (or between .27 and .28 for homogenous effects). So I’d simulate 100 studies, then meta-analyze them using PET-PEESE. And under each set of circumstances, I’d run 10,000 meta-analyses (on 100 studies per meta….so on and so forth). So that's 4 conditions x 10,000 meta analyses x 100 studies per meta-analysis...or 4 million studies total.
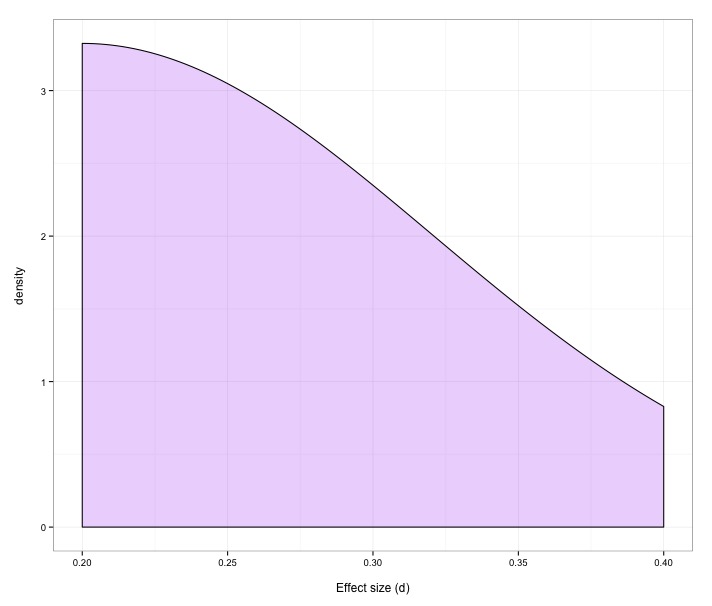
Effect size distribution for heterogenous effects

Sample size distribution
Without any more fanfare, here are the results. As you can see, PET-PEESE faces some challenges, and its performance is actually kind of scary in some cases. In every case, PET-PEESE is negatively biased (it estimates the ES lower than it actually is). The bias isn't terrible in the absence of publication bias, but is severe when publication bias exists. These graphs show density plots for the distributions of how much PET-PEESE misses the true average effect size. Median bias is presented with the purple line. Median bias of .1 just means 50% of meta-analyses are at least d=.1 too low.

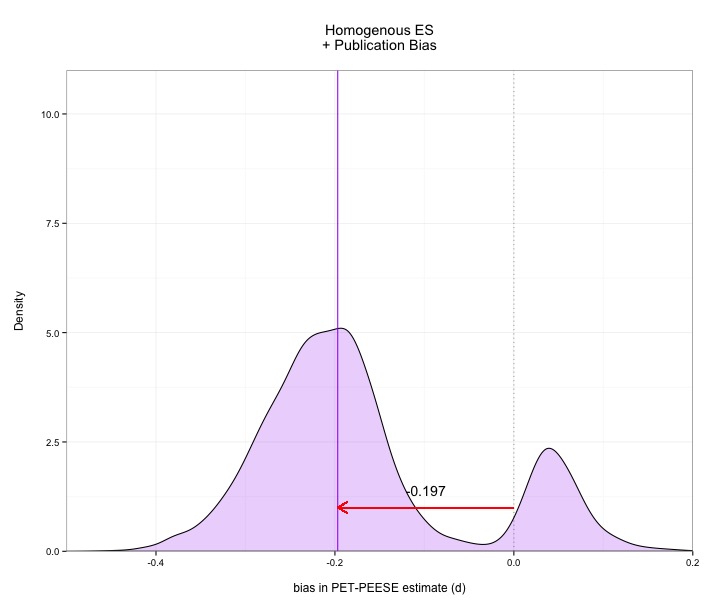
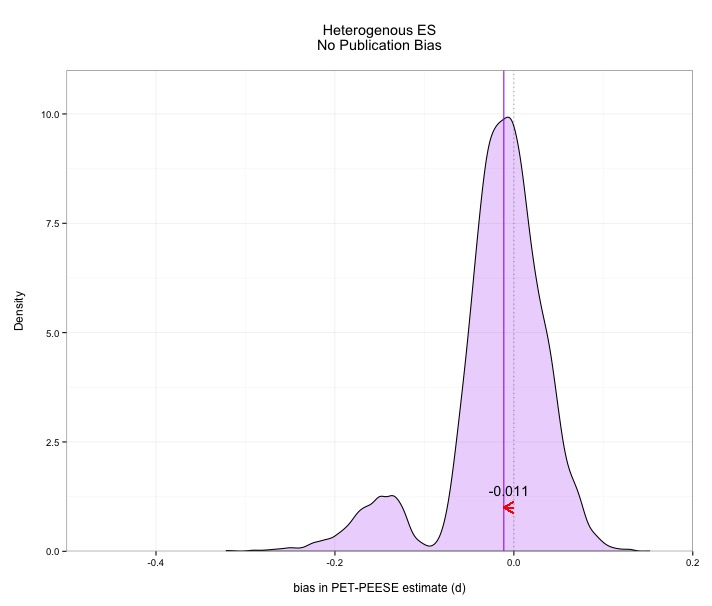

The good news: PET-PEESE isn't that bad in the absence of publication bias. The bad news: PET-PEESE is quite bad in the presence of publication bias. Now the good news isn't actually all that good, because in the absence of publication bias you don't need bias correction methods like PET-PEESE in the first place!
Under publication bias, the bias in PET-PEESE is extreme, underestimating the actual effect size by .almost .2. Ouch. This means that PET-PEESE also misses the true effect size about as often as it captures it under some circumstances. Note also how spread out these distributions are. PET-PEESE is not zeroing in on a precise estimate across multiple meta-analyses.
Perhaps most worrying, PET-PEESE very frequently claims that the effect size does not differ from zero, even though every single study out of 100 represented a genuine effect. Given publication bias, PET-PEESE misses real effects (in the range I provided) around 8 times in 10. That’s problematic. The confidence intervals provided by PET-PEESE also fail to include the real average effect size far more than the nominal 5% implied by a 95% confidence interval. In some cases, this miss rate approaches 70%
We can look at some outcomes here. Under each set of conditions (1,2 by A,B) above it is possible to ask a number of questions:
- how far off are the estimates from the true average effect size (absolute error)?
- are they consistently biased (typical direction of error)?
- does the PET-PEESE 95% CI actually contain the TRUE average effect size (accuracy)?,
- can PET-PEESE tell the difference between something and nothing (does the 95% PET-PEESE CI contain zero).
Here’s a table, and the results…

Apparent answers to those four questions are:
- without publication bias, not far. With publication bias, very far
- Yes. 60-80% of the meta-analyses underestimate the true effect size.
- Without publication bias, the miss rate is only higher than the desired 5%. Under publication bias, PET-PEESE usually fails to capture the true effect
- Not very well. And frighteningly bad under publication bias, considering the reputational costs to researchers and literatures stemming from a meta-analysis claiming an effect is not present.
So, I came into this predicting that PET-PEESE would perform poorly when underlying effect sizes vary (PET-PEESE was not designed for this condition), and especially when savvy researchers actually approximately scale their sample sizes to underlying effect sizes. It turns out that my prediction was overly optimistic. Under fairly ideal conditions (no publication bias, homogenous effects), PET-PEESE performs well. Of course, under these conditions, PET-PEESE is also wholly unnecessary. Under realistic conditions (publication bias), things get quite bad. But what about the concern regarding researcher accuracy in sample size determination?
Back to my initial question...
Does PET-PEESE do worse when researchers pick appropriate sample sizes? To address this, I was able to calculate for each meta-analysis the correlation between x: the sample size used in each study, and y: the sample size you'd want for .8 power, given whatever true sample size the simulation picked. Then, across all 10,000 simulated meta-analyses, I can see how this correlation is related to the bias in PET-PEESE.
As expected given restricted range, these relationships are negligible when effects are homogenous, regardless of whether or not publication bias was present (r = -.001 and r = -.006, respectively). But the relationships become a bit worrying when heterogeneous effects are present, both with and without publication bias (r = -.18 and r = -.26, respectively).
Here are graphs plotting the PET-PEESE bias (how much PET-PEESE’s point estimate misses the true underlying average ES) against the correlation between x: the sample size used in each study, and y: the sample size you'd want for .8 power. These graphs are for heterogenous effect sizes, with and without publication bias.Each dot is a meta-analysis of 100 studies.


Two things become apparent. First, when the correlation is zero (that is, sample sizes are random with respect to effect size), PET-PEESE is still negatively biased under publication bias. It thinks your effect is smaller than your effect actually is. On top of that, notice the downward sloping lines. This indicates that as the correlation becomes more positive, PET-PEESE becomes more negatively biased. Or, to put this another way, as researchers get better at picking appropriate sample sizes, PET-PEESE becomes even worse as a meta-analytic tool. As an aside, why does the scatterplot look like 2 distinct clusters? Remember, PET-PEESE is conditional. Sometimes it keeps the PET estimate, other times it uses PEESE. Hence two clusters.
Now, it's very much an open question as to whether we researchers actually scale our samples appropriately to different effect sizes. There's plenty of evidence out there that, at least historically, we're bad at considering anything related to statistical power (shameless plug: we care a lot about power when the consequences are made obvious). But we might have some hunches and heuristics that make us slightly better than chance at guessing whether we'll be dealing with a big effect, a small effect, or no effect. But who knows. The key point here is that whatever this relationship is, as it gets higher, PET-PEESE becomes more biased. If we somehow unlock the secret to perfectly planning our sample sizes in studies, PET-PEESE will become useless as a meta-analytic tool.
My reaction...
To be blunt, I was quite surprised at how poorly PET-PEESE performed in these simulations because on the surface it sounds like a nifty method. Yet, in a nutshell:
- PET-PEESE is not particularly accurate. It misses a lot, in both ideal and (especially) realistic contexts.
- PET-PEESE is not particularly precise. In repeated meta-analyses, the distribution of estimates varies hugely.
- PET-PEESE is biased. It claims effects are smaller than they actually are, in both ideal and (especially) realistic contexts.
- As you get better, PET-PEESE gets worse. If good researchers are able to even approximately scale their samples, PET-PEESE attributes the resulting N-ES correlation to bias. As a result, it underestimates the underlying effect.
- PET-PEESE is unable to reliably differentiate effects from non-effects. Under publication bias, this rate is scary (80%).
All in all, it’s tough to look at these results and recommend PET-PEESE, at least for literatures fitting the sample size and effect size parameters I chose. When it does perform well (no publication bias, homogenous effects), it isn't necessary. You can just run a standard meta-analysis.
It turns out this isn’t even new news in a sense. After hearing praise for PET-PEESE, I was baffled at its actual poor performance in these simulations. So I revisited the limited extant literature on it to figure out where I screwed up (that being my first assumption, and one I still can’t dismiss). One of the most cited papers showing up in PET-PEESE meta-analyses is Moreno and colleagues who ran some similar simulations in 2009. They compare PET-PEESE to various other methods, and actually recommend against the use of the tests that make up PET-PEESE. Here is what Moreno and colleagues had to say about it (bolding and square brackets by me):
“The persistent low level of coverage probability by the fixed effects Egger models (FE-se & FE-var) [read: PET and PEESE] under heterogeneous settings render them inappropriate.”
At another point in the paper, the authors say that they won’t even take the time to discuss the simulation results of PET and PEESE because it’s always outperformed by other tests. In sum, this paper recommends the use of some regression-based mata-analysis tools in some contexts…just not the tests that make up PET-PEESE.
So PET-PEESE is evidently inappropriate when heterogeneity is present. Why do the present simulations seem to also show that PET-PEESE is also negatively biased when heterogeneity is not present?
What gives? Some potentially mistaken speculation by me...
EDIT: 7-8-15: Yeah, this speculation was off. In more recent simulations, I used an alternative formula for SE that doesn't include d. PET-PEESE did not perform much better. Whatever is going on, it isn't just attributable to a quirk of one formula. But I'll keep my nonsense speculation in here for posterity. -WG
For this, I think it’s worth asking what a test like PET is doing, and then looking at the formulae used…And again, this is speculative.
What is PET doing? Looking for a positive correlation between predictor (standard error) and outcome (effect size). When there is a positive relationship, PET will attribute that to bias, and return an “ideal perfect study” effect size estimate that is lower than the average observed effect size—and sometimes lower than the lowest observed effect size. But when you look at the formula for the standard error of Cohen’s d, you will see that it includes Cohen’s d.

A larger effect size (d) will always have a larger standard error, holding sample size constant. Thus there will always be a positive relationship between d and se(d), leading PET (or PEESE) to always come up with a negatively biased effect size estimate. The formula makes this inescapable. It’s analogous to predicting IQ from academic achievement using an academic achievement measure that incorporates IQ. Speculatively, this might also explain why the present results differ from some previous simulations showing that PET-PEESE might be accurate and unbiased at least under some conditions. Previous simulations were looking at odds ratios (ln(OR) actually) and relative risk as effect size estimates, rather than Cohen’s d. And the calculation for standard errors of ln(OR) does not include ln(OR) in any way. Similar for relative risk and its standard error. For odds ratios and relative risk, effect size and standard error are independent. For Cohen’s d, se depends in part on d. Thus, PET-PEESE will always find an se-d relationship, and hence underestimate the effect size of Cohen’s d.
At the same time, the same previous favorable simulations for PET-PEESE let both effect size and sample size vary completely at random (as I did), but don’t explore how genuine (i.e., not introduced by bias) relationships affect the estimates. But it seems quite clear to me (both conceptually, and from the present simulations) that any such genuine relationship will negatively bias PET-PEESE. Effect size and precision of an effect size estimate can be related because of bias. But they aren't solely caused by bias. They can also be caused by the proper use of power analysis.
In all honesty, I find all of this a bit disheartening. As I mentioned, when I first started reading about PET-PEESE, it just felt like a good solution. I really want a tool like PET-PEESE to work. I’m honestly bummed out about the results of these simulations.
Where now?
This was an eye opening exercise for me. Among other things, it looks like PET-PEESE is at its worst when 1) there is publication bias, 2) true effect sizes vary, and 3) researchers aren't entirely clueless when it comes to picking sample sizes. I'd argue that's a pretty good description of the world we currently occupy.
So, what to do? I’m not one with the temperament, statistical acumen, or authority to make any grand pronouncements. But I know I won’t be using PET-PEESE any time soon, and I’ll be very cautious to draw conclusions from any PET-PEESEs I see, especially if they report tiny-to-nil effects based on Cohen's d. Based on these simulations, PET-PEESE looks to claim nil effects both for actual nil effects and also for actual small-to-medium effects in some plausible circumstances. In the meantime, I’ll be working on a paper comparing existing alternatives to PET-PEESE. That Moreno paper provides a good hint: the Peters test is the one they recommend (like PET-PEESE, but focused on total sample size as a predictor…this cuts the Gordian knot of calculating se with d), and when I include it in the present simulations, it looks to be much much better than PET-PEESE in every case (accuracy, precision, ability to tell something from nothing, etc.). But it leaves me with the problem I started with: It’ll still fall prey to the trap of researchers getting better at picking sample sizes, and I don't like a method that penalizes good research behavior. But that’s a topic for another day, and a properly peer-reviewed manuscript.
Now, caveats:

I always thought he said "Monday detail" in an ongoing "case of the Mondays" joke. The internet tells me I was, once again, wrong.
Caveat 1: Again, I’m still learning R simulations, and I could've screwed this up on some mundane detail. So here’s the code. And if you want to play around with the data without having to wait all day for the simulation to run, here is a .zip file with saved data from my simulations. Maybe PET-PEESE is a rock star and I’m a dunce. If so, feel free to help me figure out what the code misses (be gentle…). But I’m reasonably confident in what these simulations show. The fact that they’re consistent with Moreno et al. helps. As does the quick consideration of the formula for se(d). And hey, if you feel like helping out on my half-baked (but work in progress) idea for a manuscript based around simulations comparing things like PET-PEESE, p-curve, and Peters tests, shoot me an email or something. But please don’t take the code I wrote and scoop me…I’m a lowly Assistant Professor, and scooping is for meanie faces. That would make me sad, and would hopefully make you at least gassy or uncomfortable or something.

Stop. Hammer time.
Caveat 2 (long-winded): For my money, “heterogenous effects + publication bias” is the most realistic description of our current literature. And I hope there's some correlation between effect sizes and people's sample size choices (right?!?). But feel free to disagree with any of these claims. We all know publication bias exists…no arguments there. But why assume heterogeneity of effects? Well, there is no such thing as a single underlying effect size. Let’s say I’m interested in the effect of distraction on a memory. I can use different manipulations of distraction, ranging from blasting noise to memorizing numbers to hitting people in the face with a ball-peen hammer. I can use various measures of memory: numbers, letters, shapes, hard lists, easy lists. And my participants will have different underlying personalities, levels of focus, intelligence, hammer-proof-skullness, etc. Each combination of manipulation, measure, and population composition will yield a different “true” underlying effect size. But if lots of researchers run lots of studies on this same idea with lots of different methods and populations (we variously call this “science” “replication” “conceptual replication” “addressing the WEIRD people issue” and “generalizability”), they will essentially be studying the same idea with heterogenous underlying effect sizes. Or, to take a literature closer to my own interests, let’s say I’m examining whether religious primes change how people act. I could use overt or subtle primes…presumably some priming techniques are stronger than others. I could use self-report or other measures of how people act…presumably some are more sensitive than others. And my samples will have different mixes of believers and nonbelievers…existing evidence suggests that religious primes don’t affect nonbelievers. So the “true” effect size will depend on 1) priming technique, 2) dependent measure, and 3) ratio of believers:nonbelievers in a sample. Unless I run the exact same study on the exact same samples (believer:nonbeliever-wise), I am studying heterogenous effects. As a result, I should probably not use PET-PEESE in a meta-analysis, according to Moreno et al.
Caveat 3: PET-PEESE has been popping up in some psych papers lately. If it turns out to not work, does that mean that we should ignore criticisms of the domains that PET-PEESE has been used to flag as potentially problematic? Of course not! There do seem to be some serious (and seriously interesting!) issues surrounding research into topics like self-control. Personally, I'm unconvinced that self-control is a finite and depletable resource, regardless of whether or not PET-PEESE turns out to be the right tool for the job. So let’s definitely look into this stuff. All I’m saying is that we should be using all the tools we have to 1) evaluate our literatures, and to 2) evaluate all the tools we have.
Caveat 4: Sorry for boring you to death, even if this is a topic you care about. But here’s an only-slightly-relevant song that I like. PEESE forgive me.

As always, feel free to comment.