EDIT 7-8-15: After some more digging, I'm no longer as confident in Peters. Make sure you check out my qualification at the bottom. It seemed so good at first...I blame Lionel.
In a previous installment I presented the results of a series of simulations aimed at evaluating the performance of PET-PEESE as a meta-analytic tool. Long story short: I tried to pick sample sizes and effect sizes that were representative of my own discipline (social psych). And I modeled the presence and absence of both heterogenous effects and publication bias. And in the end, PET-PEESE performed poorly. It often failed to capture real effect sizes in its estimates. it wasn't particularly precise with its estimates. It was consistently negatively biased. And, perhaps most worrying, under conditions of publication bias, it failed to detect genuine effects a majority of the time. This was a bit disappointing, because I like the core logic of PET-PEESE, and PET-PEESE has started to pop up as a tool in the literature. So I wanted it to work.
In this installment, I'll present some further simulations that 1) address potential shortcomings in the previous set, and 2) provide another test for comparison: the Peters test. Conceptually, the Peters test is very similar to PET-PEESE. You're still predicting effect size from a measure of the precision of each effect size estimate. It's still a WLS regression. And you're still interpreting the intercept as the effect size of an infinitely precise study. The only differences come in what is used as a predictor, and the associated weights. PET-PEESE uses either the standard error or variance as a predictor. Peters use the inverse of total sample size, and weights observations by total sample size. Pretty straightforward.
In continuation of the musical theme used in the last blog post, here are my current feelings towards Peters:
What I did
In the previous simulations, I was a bit worried that the formula I was using for the standard error of the effect size estimate itself included the effect size estimate. To me, it seemed this would create a meaningless correlation between ES and the standard error. In the present batch, I fixed this. Turns out my speculation about the previous formula being to blame for PET-PEESE's performance was, Scalia would say, "applesauce." It didn't have much effect.
I also added in the Peters test, for comparison. Again, Peters predicts effect size (d) by the inverse of total sample size (1/tot N), and weights everything by sample size (tot N). Pretty dang easy.
As one final tweak, I also added in a condition where the true effect size is zero, and publication bias is all that's going on. I bumped it from 100 to 1000 studies per meta-analysis in this condition, to ensure there'd be some studies to meta-analyze.
What I found
Once again, PET-PEESE fared poorly. It did okay when there was no publication bias (which is also when it's unnecessary), but it performed poorly in the presence of publication bias. It failed to capture the real effect about 40% of the time, and still failed to detect genuine effects about 60% of the time. Those are both very worrying.
Peters, on the other hand...

As before, here is a table with some outcomes.

Rounded to 2 decimals, the average bias in Peters is...zero. When there is a real effect present (regardless of publication bias), Peters makes the right choice 100% of the time...zero errors in 40,000 simulations. Zero. It's also worth checking out the % Missed column for Peters. The 95% CI fails to include the real value pretty much exactly 5% of the time. As it should, given what a 95% CI means. Finally, it frequently gives more precise estimates than does PET-PEESE. The range of the CI is half as big for Peters when publication bias is present with real effects. It is about 20 times narrower than PET-PEESE in the absence of real effects. PET-PEESE gives vague, and often incorrect, answers much of the time (when there is no true effect, PET-PEESE was unbiased, but largely useless, saying the effect was probably between -.5 and .5. Thanks). Peters gives relatively specific answers that tend to be right. Good on ya Peters!
To help visualize this, here are some more density plots showing both PET-PEESE and Peters on the same graph, under various conditions (focusing only on the interesting ones...when publication bias is present). The vertical lines represent median bias.


Notice that Peters is just a tad more specific in its estimate here, even though both are unbiased.
In every case, Peters was unbiased and specific.
What are the negatives?
I could only find one. And this goes back to the problem I started with: what happens if researchers are good at picking appropriate sample sizes for their studies? Will this accuracy be flagged as bias?
Like PET-PEESE, any genuine correlation between ES and N led to negative bias. Here are some scatterplots showing what happens as researchers get better at planning studies (as you move right on the graph):
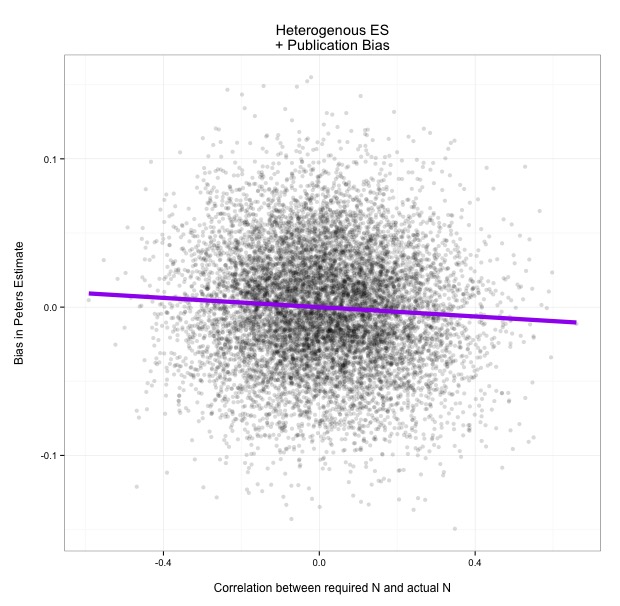

There you have it. It looks like it would be fair to be a bit concerned about Peters in a world with no publication bias, and a relatively high correlation between required sample size and actual sample size. Maybe we'll get to that world one day...but we certainly don't live in that world right now.
In the meantime, I'd say that these results suggest that the Peters test might be a viable alternative to PET-PEESE. Relative to PET-PEESE, Peters is in realistic conditions:
- More accurate
- Less biased
- More precise
- Better able to control misses
- Better able to tell something from nothing
- Apparently very conservative when it comes to calling effects nil
Not bad, all in all.
UPDATE: NEW STUFF FROM HERE DOWN
Okay, now for the bad news, update 7-8-15. Is Peters still dominating? Well, not so much...
If my initial impressions of Peters were all Lionel and Depeche Mode, my current view might be more like this (apologies in advance...):
Why, Peters? Why did you play with my heart like that?
Peters looked so good, and I decided to dig deeper. In particular, it seemed odd how precisely Peters was nailing the null effect. Turns out, my code for publication bias was just keeping all statistically significant effects, regardless of sign. There'd by chance be some significant positive effects and some significant negative effects. Peters was good at splitting the difference. This was an easy fix. But when all you have is publication bias, and it's directional, Peters can no longer spot the null...it estimated an effect size around ~ .25. That's not good.
So I decided to run some more simulations looking at how biased different methods were under publication bias, across a wider range of potential effect sizes. For the basic setup, I'd have the sim run a bunch of meta-analyses on generated sets of "studies." Within each meta-analysis, there'd be a fixed effect size for the studies. But across the metas, the effect size varied randomly from .05 to 1.0. So, how biased was Peters at different levels? I already knew that it's essentially unbiased around .28, but positively biased at zero. What about the rest...

How weird is that?
So Peters looked great because by dumb luck I happened to initially be sampling effects around .28, where Peters is evidently quite good. But at other values, Peters can be either negatively or positively biased. That's quirky. You see similar things with 95% CI coverage at different effect sizes: sometimes it's good, sometimes it's not.

Similarly things happen for other regression-based meta techniques. Here's PET and PEESE bias, respectively, across the spectrum:


Weird, right? Each method looks to have a "sweet spot" where it performs well, and other ranges where it's garbage essentially. I'm guessing this has more to do with strength of publication bias than about effect size, per se (smaller effects are facing more severe publication bias in a sense in these sims...you see feweer of the studies that were actually "run"). But all of the regression-based methods faced this same challenge. And it isn't a trivial challenge by any means. Unless you can overcome it somehow, then you're looking at conversations like this:
- Researcher A: "I'm trying to figure out how big an effect is, what should I do?"
- Researcher B: "Easy, run a meta-analysis. We have loads of methods for that."
- Researcher A: "Okay, which method should I use?"
- Researcher B: "Well, how big is your effect?"
Not ideal.
For what it's worth, here's how pcurve fares in this same simulation:

Doesn't that look better?

Ah yes, code and whatnot. For the code, here were the only changes (I'm still working on various aspects of the code, but you should be able to plug this in where needed without too much fuss)...
Peters method
pred <- 1/(2*nobs) wt <- pred^-1
peters <- lm(dobs ~ pred, weights = wt) peters.d <- summary(peters)$coefficients[1] peters.ld <- confint(peters)[1,1] peters.ud <- confint(peters)[1,2]
peters.bias = peters.d - mean.real
And here's the data